Introduction to Error Handling in JavaScript
In the realm of web development, encountering errors is inevitable. But fear not! Proper error handling can save you from headaches and ensure a smooth user experience. This blog post aims to equip JavaScript developers with the knowledge to effectively handle and debug errors. By mastering these skills, you’ll not only become a more efficient coder, but also enhance the reliability of your applications.
Understanding JavaScript Error Types
Syntax errors, type errors, and reference errors
JavaScript errors come in various forms, each with its own characteristics. Understanding these common error types is the first step toward effective debugging.
- Syntax errors occur when there’s a mistake in the code’s syntax, such as a missing parenthesis or a misplaced semicolon.
- Type errors happen when a value is not of the expected type, like trying to call a non-function as a function.
- Reference errors arise when referencing a variable that hasn’t been declared or is out of scope.

Examples of Common Error Types and Their Causes
- Syntax Error Example:
javascript
console.log(‘Hello World’
// Missing closing parenthesis
- Type Error Example:
javascript
const num = 42;
num(); // TypeError because num is not a function
- Reference Error Example:
javascript
console.log(x); // ReferenceError because x is not defined
The Role of the `try…catch` Statement
How `try…catch` Works in JavaScript
The `try…catch` statement allows you to catch and handle errors gracefully, preventing your application from crashing.
- try Block:
Contains the code that may throw an error.
- catch Block:
Executes if an error occurs in the `try` block, allowing you to handle the error.
Best Practices for Using `try…catch`
- Use `try…catch` sparingly to avoid masking issues.
- Ensure the `catch` block provides useful error messages.
- Maintain readability by avoiding deeply nested `try…catch` blocks.
Throwing Custom Errors with `throw`
Creating custom error messages
By using the `throw` statement, you can create custom error messages to provide more context about what went wrong.
javascript
function validateAge(age) {
if (age < 18) {
throw new Error(‘Age must be 18 or older’);
}
}
When and Why to Use `throw` in JavaScript
Use `throw` to handle specific error conditions that require customized responses, improving the clarity and maintainability of your code.
Using the `finally` block
The Purpose of the `finally` Block
The `finally` block ensures that certain code executes regardless of whether an error occurs, making it ideal for cleanup tasks.
javascript
try {
// Code that may throw an error
} catch (error){
// Handle the error
} finally {
// Code that executes no matter what
}
Ensuring code execution with `finally`
- Close connections, such as file or database handles.
- Perform actions that must always occur, like logging or resetting states.
JavaScript Error Objects
Anatomy of a JavaScript Error Object
JavaScript error objects contain useful information for debugging.
- message: Description of the error.
- name: Type of the error.
- stack: Stack trace (call stack) at the point the error was thrown.
Accessing Error Information (message, name, stack)
javascript
try {
throw new Error(‘Something went wrong’);
} catch (error){
console.log(error.message); // ‘Something went wrong’
console.log(error.name); // ‘Error’
console.log(error.stack); // Stack trace
}
Handling Asynchronous Errors
Error Handling in Callbacks
Handling errors in asynchronous code can be tricky. For callbacks, always check for errors in the callback function.
javascript
fs.readFile(‘file.txt’, (err, data) => {
if (err) {
console.error(err);
return;
}
console.log(data);
});

Managing Errors in Promises and `async/await`
- Promises:
javascript
fetch(‘https://api.example.com/data’)
.then(response => response.json())
.catch(error => console.error(‘Error:’, error));
- async/await:
javascript
async function fetchData() {
try {
const response = await fetch(‘https://api.example.com/data’);
const data = await response.json();
console.log(data);
} catch (error){
console.error(‘Error:’, error);
}
}
Working with `Promise.prototype.catch`
Error Handling in Promise Chains
Utilize `.catch()` at the end of a promise chain to handle errors that occur at any point in the chain.
javascript
fetch(‘https://api.example.com/data’)
.then(response => response.json())
.then(data => console.log(data))
.catch(error => console.error(‘Error:’, error));
Common Pitfalls When Using `catch` with Promises
- Be cautious of swallowed errors.
- Ensure error handling logic is relevant to the errors being caught.
Error Handling in `async/await`
Using `try…catch` with Asynchronous Functions
Wrap `async/await` code in `try…catch` blocks to handle errors.
javascript
async function getData() {
try {
const data = await fetchData();
console.log(data);
} catch (error){
console.error(‘Error:’, error);
}
}
Best Practices for Error Handling in Asynchronous Code
- Keep `try…catch` blocks close to the asynchronous operation.
- Use centralized error handling when appropriate.
Debugging Tools in JavaScript
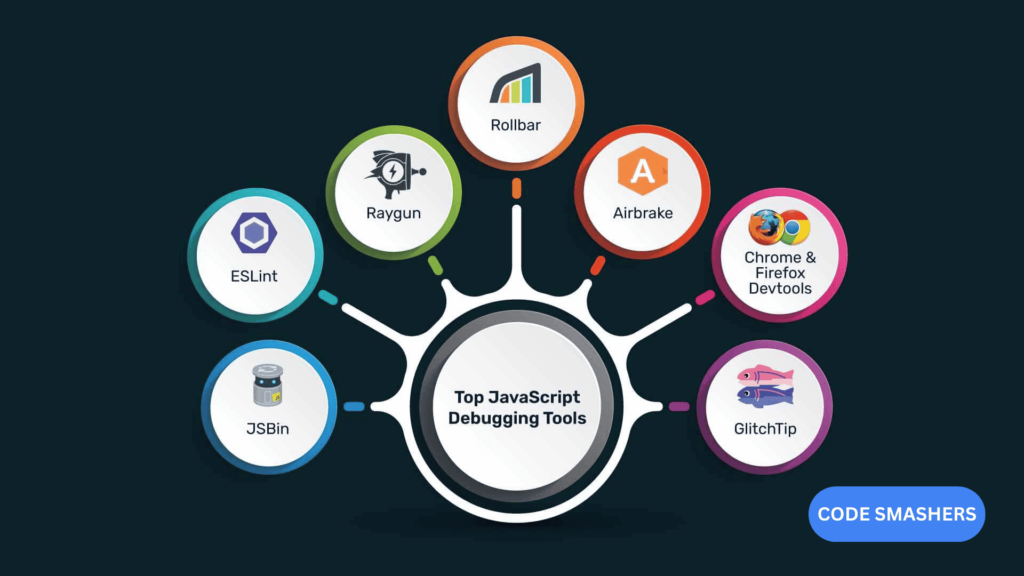
Overview of Chrome DevTools and Other Debugging Tools
Chrome DevTools and other browser-based tools offer powerful features for debugging JavaScript.
- Elements Panel for inspecting DOM elements.
- Console Panel for running JavaScript and viewing logs.
- Sources Panel for setting breakpoints and stepping through code.
How to Access and Use Built-In Debugging Tools
- Open DevTools with `F12` or `Ctrl + Shift + I`.
- Use the console to log information and interact with your code.
- Explore the Sources panel to view scripts and set breakpoints.
Setting Breakpoints in JavaScript
How to Set and Manage Breakpoints in DevTools
Breakpoints allow you to pause code execution at specific points.
- Navigate to the Sources panel.
- Click the line number where you want to set a breakpoint.
Using Conditional Breakpoints for Complex Debugging
Conditional breakpoints pause execution only when a specified condition is met, which is useful for complex debugging scenarios.
javascript
// Example condition
if (x > 10) {
debugger;
}
Debugging Tips and Tricks
- Use the `debugger` keyword to set breakpoints directly in your code.
- Step through code with Step Over, Step Into, and Step Out buttons.
- Explore the Scope Variables pane to inspect the values of variables at a given point in execution. 1

Advanced Debugging Techniques
Leveraging the Power of Console
The console is one of the most versatile debugging tools available for JavaScript developers. With a variety of console methods, such as `console.log()`, `console.warn()`, and `console.error()`, you can obtain instant feedback about variable values, code flow, and potential issues in your scripts. For more organized output, consider using `console.table()` to display arrays and objects in a tabular format. Additionally, utilizing `console.group()` and `console.groupEnd()` can help categorize logs, making complex logging scenarios more manageable.
Breakpoints Beyond the Basics
In addition to simple breakpoints, which pause execution on a specified line, developers can use advanced breakpoint types to streamline debugging. Conditional breakpoints stop execution only when a certain condition is true, while logpoints insert messages into the console without interrupting code flow. These advanced features allow you to isolate and investigate specific conditions or variable states within complex applications, thus minimizing the time spent debugging.
Using Network and Performance Tools
The Network panel in DevTools provides insights into HTTP requests, helping you track response times, status codes, and request headers. This is invaluable for detecting and diagnosing network-related issues, such as failed API calls or slow-loading resources. Complementarily, the Performance panel lets you record and analyze the runtime behavior of your application, including reflows, paints, and CPU usage, enabling you to enhance the responsiveness and efficiency of your code.
Source Maps for Transpiled Code
Working with transpiled languages like TypeScript or tools like Babel often results in compiled JavaScript that can be difficult to debug. Source maps bridge the gap between the original and compiled source, allowing developers to set breakpoints and navigate code as if they were working with their original codebase. Ensuring your build process generates source maps can significantly simplify debugging tasks in a modern JavaScript development environment.
Remote Debugging
Browser-based tools like Chrome DevTools can also be used for debugging beyond the confines of a local environment. Remote debugging allows you to inspect and troubleshoot code running on remote devices, such as smartphones or tablets. By utilizing features like USB connection and port forwarding, you can replicate the user experience on different devices and screen sizes, ensuring consistent behavior across platforms. This capability is particularly useful for developing mobile-friendly applications.
Conclusion
In this tutorial, we discussed best practices for handling errors in JavaScript using `try…catch`, `throw`, and `finally` blocks. We also explored different types of error objects and how to handle asynchronous errors in promises and `async/await` functions. Additionally, we learned about the debugging tools available in Chrome DevTools and other browsers, including how to set breakpoints, use conditional breakpoints, and leverage the power of console logging. Finally, we touched on advanced debugging techniques such as using network and performance tools, working with source maps, and remote debugging for mobile development. With this knowledge in hand, you can confidently tackle errors and bugs in your JavaScript applications like a pro.
References
